Configuring the Debug Recording Server Address
The procedure below describes how to configure the address of the debug recording server to where the device sends the captured traffic. Once you configure an address, the device generates debug recording packets for all calls. However, you can configure the device to generate debug recording packets for specific calls, using Logging Filter rules in the Logging Filters table (see Configuring Log Filter Rules).
|
●
|
When the debug recording server is configured with an IPv4 address for Dual Network Mode, the device sends the debug recording packets through its OAMP interface, by default. |
|
●
|
You can also save debug recordings to an external USB hard drive that is connected to the device's USB port. For more information, see USB Storage Capabilities.
|
|
➢
|
To configure the debug recording server's address: |
|
1.
|
Open the Logging Settings page (Troubleshoot tab > Troubleshoot menu > Logging folder > Logging Settings). |
|
2.
|
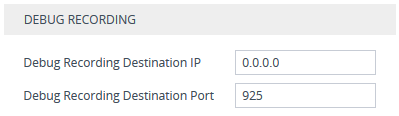
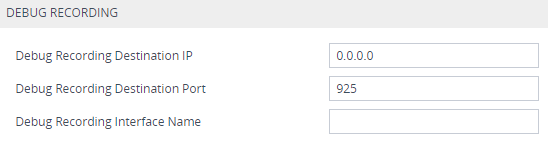
In the 'Debug Recording Destination IP' field, configure the IP address (IPv4 or IPv6) of the debug capturing server. |
|
3.
|
In the 'Debug Recording Destination Port' field, configure the port of the debug capturing server. |
|
4.
|
In the 'Debug Recording Interface Name' field, configure the local network interface through which the debug recording packets are sent. When the device operates in Single Network Mode (SingleNetworkMode = 1): |
|
●
|
If the server is configured with an IPv4 address, configure the 'Debug Recording Interface Name' field to "WAN" (or "WAN <VRF Name>) for WAN, or to the name of the LAN interface for LAN. |
|
●
|
If the server is configured with an IPv6 address, configure the 'Debug Recording Interface Name' field to "WAN IPv6" (or "WAN VRF <Name> IPv6"), or to the name of the LAN interface for LAN. |
This should be the same local network interface as used by the SIP application.